
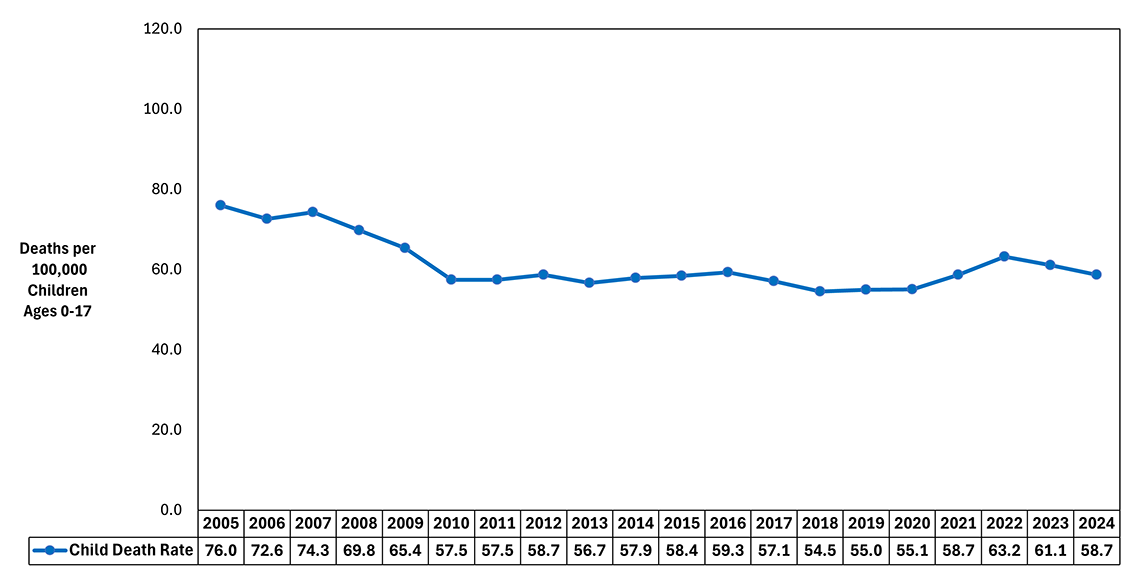
Figure Summary: This line graph shows the overall child death rates among children 0 to 17 over the last two decades (2005-2024). Death rates are per 100,000 resident population ages 0 to 17. Death rates prior to 2024 have been recalculated using the latest population estimates available. The data table below presents the data in tabular form.
| Year | Child Death Rate |
|---|---|
| 2005 | 76.0 |
| 2006 | 72.6 |
| 2007 | 74.3 |
| 2008 | 69.8 |
| 2009 | 65.4 |
| 2010 | 57.5 |
| 2011 | 57.5 |
| 2012 | 58.7 |
| 2013 | 56.7 |
| 2014 | 57.9 |
| 2015 | 58.4 |
| 2016 | 59.3 |
| 2017 | 57.1 |
| 2018 | 54.5 |
| 2019 | 55.0 |
| 2020 | 55.1 |
| 2021 | 58.7 |
| 2022 | 63.2 |
| 2023 | 61.1 |
| 2024 | 58.7 |

FOLLOW US