
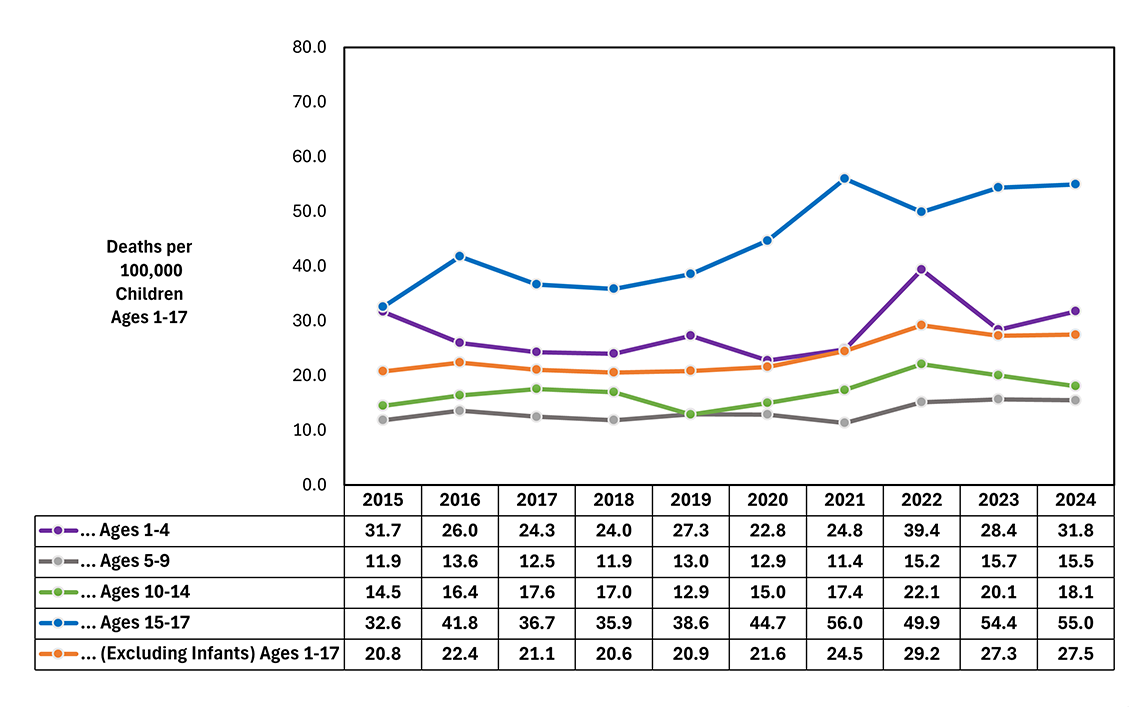
Figure Summary: The line graph presenting trends in child death rates by age group displays rates for the ten-year period 2015-2024. Rates are displayed for all child deaths ages 0 through 17, ages 1 through 17 (excluding infants), as well as four age groups: 1 to 4, 5 to 9, 10 to 14, and 15 to 17. Rates are presented per 100,000 resident children in that age group. Death rates prior to 2024 have been recalculated using the latest population estimates available. The table below presents the data in tabular form.
| 2015 | 2016 | 2017 | 2018 | 2019 | 2020 | 2021 | 2022 | 2023 | 2024 | |
|---|---|---|---|---|---|---|---|---|---|---|
| Ages 1-4 | 31.7 | 26.0 | 24.3 | 24.0 | 27.3 | 22.8 | 24.8 | 39.4 | 28.4 | 31.8 |
| Ages 5-9 | 11.9 | 13.6 | 12.5 | 11.9 | 13.0 | 12.9 | 11.4 | 15.2 | 15.7 | 15.5 |
| Ages 10-14 | 14.5 | 16.4 | 17.6 | 17.0 | 12.9 | 15.0 | 17.4 | 22.1 | 20.1 | 18.1 |
| Ages 15-17 | 32.6 | 41.8 | 36.7 | 35.9 | 38.6 | 44.7 | 56.0 | 49.9 | 54.4 | 55.0 |
| (Excluding Infants) Ages 1-17 | 20.8 | 22.4 | 21.1 | 20.6 | 20.9 | 21.6 | 24.5 | 29.2 | 27.3 | 27.5 |

FOLLOW US