
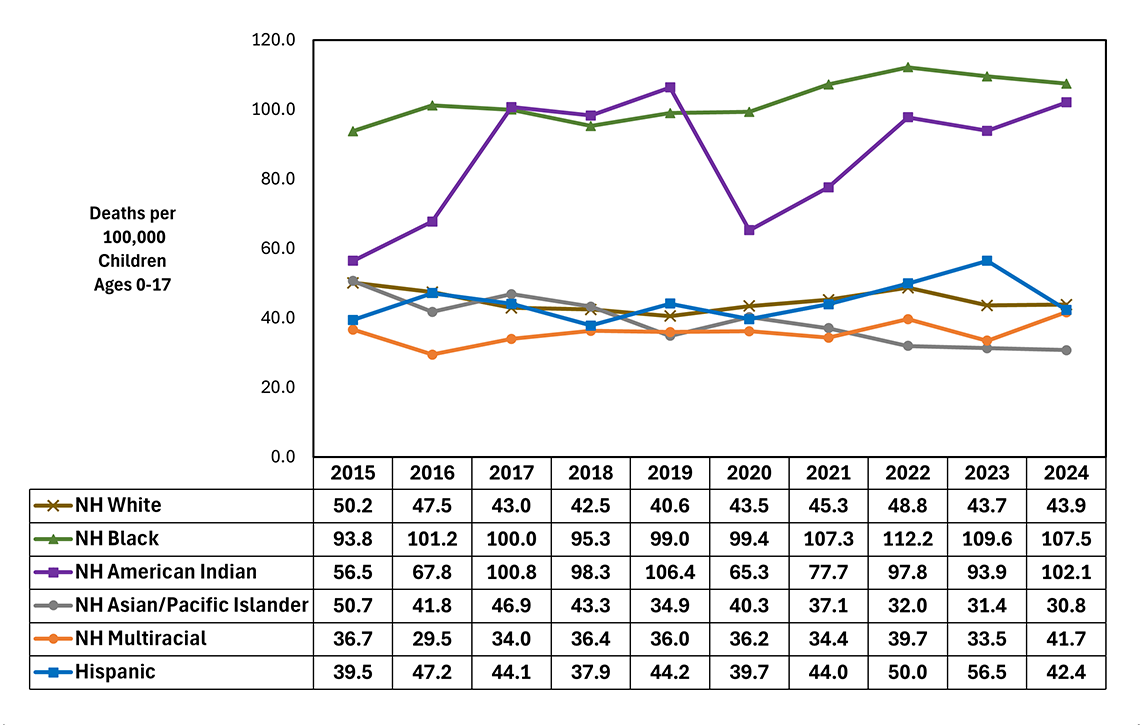
Figure Summary: This line graph presents trends in child death rates by race/ethnicity from 2015-2024. All racial/ethnic groups presented are mutually exclusive categories. Rates are presented per 100,000 child population (ages 0-17) in that racial/ethnic group. Racial categories have changed from prior years and now reflect single race categories and multi-race. Death rates prior to 2024 have been recalculated using the latest population estimates available. As a result of changes in racial classification, comparisons with prior reports that did not use the same racial classifications are not advised. The table below presents the data in tabular form.
| 2015 | 2016 | 2017 | 2018 | 2019 | 2020 | 2021 | 2022 | 2023 | 2024 | |
|---|---|---|---|---|---|---|---|---|---|---|
| NH White | 50.2 | 47.5 | 43.0 | 42.5 | 40.6 | 43.5 | 45.3 | 48.8 | 43.7 | 43.9 |
| NH Black | 93.8 | 101.2 | 100.0 | 95.3 | 99.0 | 99.4 | 107.3 | 112.2 | 109.6 | 107.5 |
| NH American Indian | 56.5 | 67.8 | 100.8 | 98.3 | 106.4 | 65.3 | 77.7 | 97.8 | 93.9 | 102.1 |
| NH Asian/Pacific Islander | 50.7 | 41.8 | 46.9 | 43.3 | 34.9 | 40.3 | 37.1 | 32.0 | 31.4 | 30.8 |
| NH Multiracial | 36.7 | 29.5 | 34.0 | 36.4 | 36.0 | 36.2 | 34.4 | 39.7 | 33.5 | 41.7 |
| Hispanic | 39.5 | 47.2 | 44.1 | 37.9 | 44.2 | 39.7 | 44.0 | 50.0 | 56.5 | 42.4 |
*Caution: Racial categories have changed from prior years and now reflect single race categories and multi-race. Comparisons with prior reports are not advised.
NH = Non-Hispanic

FOLLOW US