
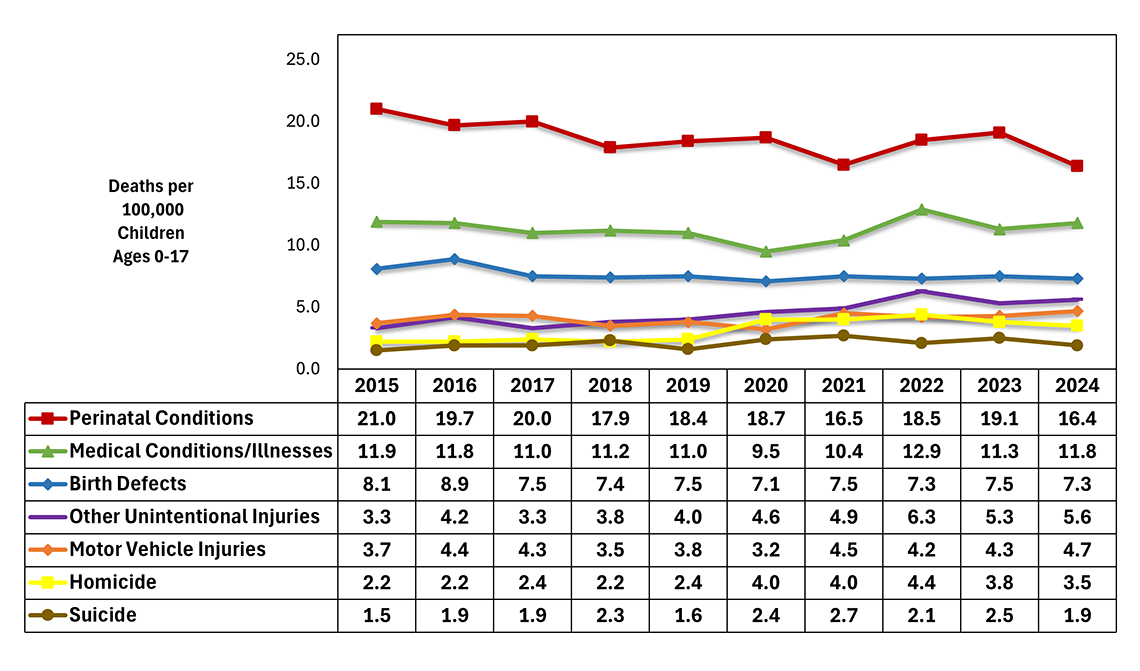
Figure Summary: The line graph presenting trends in child death rates by cause of death displays rates for the ten-year period 2015-2024. Rates are displayed for major cause of death categories; per 100,000 resident children (ages 0-17). When reviewing this graph, it is important to keep in mind that certain cause of death categories such as birth defects, perinatal conditions, and suicides occur more frequently in specific age groups. Therefore, rates presented here may underestimate age-specific cause of death rates for these categories. A data table below the chart presents the data in tabular form. The table below presents the data in tabular form.
| 2015 | 2016 | 2017 | 2018 | 2019 | 2020 | 2021 | 2022 | 2023 | 2024 | |
|---|---|---|---|---|---|---|---|---|---|---|
| Perinatal Conditions | 21.0 | 19.7 | 20.0 | 17.9 | 18.4 | 18.7 | 16.5 | 18.5 | 19.1 | 16.4 |
| Medical Conditions/Illnesses | 11.9 | 11.8 | 11.0 | 11.2 | 11.0 | 9.5 | 10.4 | 12.9 | 11.3 | 11.8 |
| Birth Defects | 8.1 | 8.9 | 7.5 | 7.4 | 7.5 | 7.1 | 7.5 | 7.3 | 7.5 | 7.3 |
| Motor Vehicle Injuries | 3.7 | 4.4 | 4.3 | 3.5 | 3.8 | 3.2 | 4.5 | 4.2 | 4.3 | 4.7 |
| Other Unintentional Injuries | 3.3 | 4.2 | 3.3 | 3.8 | 4.0 | 4.6 | 4.9 | 6.3 | 5.3 | 5.6 |
| Homicide | 2.2 | 2.2 | 2.4 | 2.2 | 2.4 | 4.0 | 4.0 | 4.4 | 3.8 | 3.5 |
| Suicide | 1.5 | 1.9 | 1.9 | 2.3 | 1.6 | 2.4 | 2.7 | 2.1 | 2.5 | 1.9 |

FOLLOW US