Central Cancer Registry
An award-winning poster session
By Bob Allis
North Carolina Central Cancer Registry
State Center for Health Statistics
for the 1999 Annual Meeting
North American Association of Central Cancer Registries
The legislation in North Carolina requires the collection of follow-up data by the Central Cancer Registry. This study compares the passive follow-up method to the active follow-up method that requires many more resources.
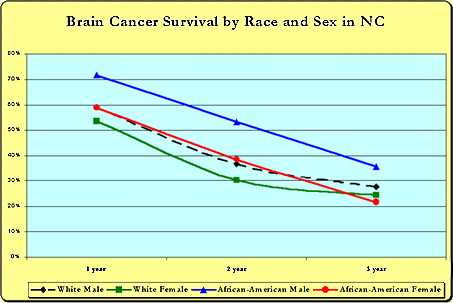
This study examines the survival rates among brain cancer patients in North Carolina from the period of 1990 through 1995. Follow-up of these patients is carried through 1997. There were 2778 cases of brain cancer in that period of time. The results are to be compared with SEER data to check for reliability of the data and to determine the effectiveness of passive follow-up.
The SEER program provides active follow-up on all living patients of cancer except those with in situ cancer of the cervix uteri. This method requires a great deal of resources.
Many Cancer Registries do not have sufficient resources to conduct active follow-up on patients. The aim of this study is to see whether the passive method of follow-up yields similar and reliable results to those using more resource-intensive methods.
A survival analysis is an ideal tool to measure this, since it depends on current vital status and information about each patient.

| Observed Survival Rates (NCCCR) | ||||||
| 1990 | 1991 | 1992 | 1993 | 1994 | 1995 | |
| 1 year | 57.1 | 57.9 | 59.3 | 60.7 | 56.2 | 57.8 |
| 2 year | 34.3 | 35.0 | 36.5 | 34.7 | 36.3 | |
| 3 year | 28.1 | 30.2 | 31.8 | 26.1 | ||
| 4 year | 23.4 | 26.7 | 26.7 | |||
| 5 year | 21.0 | 22.0 | ||||
| 6 year | 18.1 | |||||
| Relative Survival Rates (SEER) | ||||||
| 1989 | 1990 | 1991 | 1992 | 1993 | 1994 | |
| 1 year | 52.4 | 54.1 | 54.4 | 52.4 | 53.1 | 53.1 |
| 2 year | 37.5 | 37.7 | 40.0 | 39.0 | 38.3 | |
| 3 year | 33.0 | 32.6 | 36.5 | 34.7 | ||
| 4 year | 30.0 | 30.8 | 34.7 | |||
| 5 year | 28.8 | 29.3 | ||||
| 6 year | 27.8 | |||||